
Chapter 9 of 14 · about 30 min
Corners: the Simulation Environment
A chip must work on every die the factory makes, at every temperature and supply it will see. Corners are the extreme combinations. FOSSLab’s Simulation Environment runs them, like Cadence’s ADE and its corner tool: you describe the corners in a table and the measurements in another, press Run, and read a table of results with pass/fail against the specifications.
1. Open the Simulation Environment
Select the testbench tb_opamp_ac in the Library Manager and press Sim. Environment (or right-click > Simulation Environment…, or in xschem FOSSLab > Simulation Environment). One window per testbench, with five tabs. Whatever you set is saved with the testbench (Save setup, and automatically at every run) in tb_opamp_ac.ade.json, next to its schematic: it is there the next time, for you and for your teacher.
2. Design variables
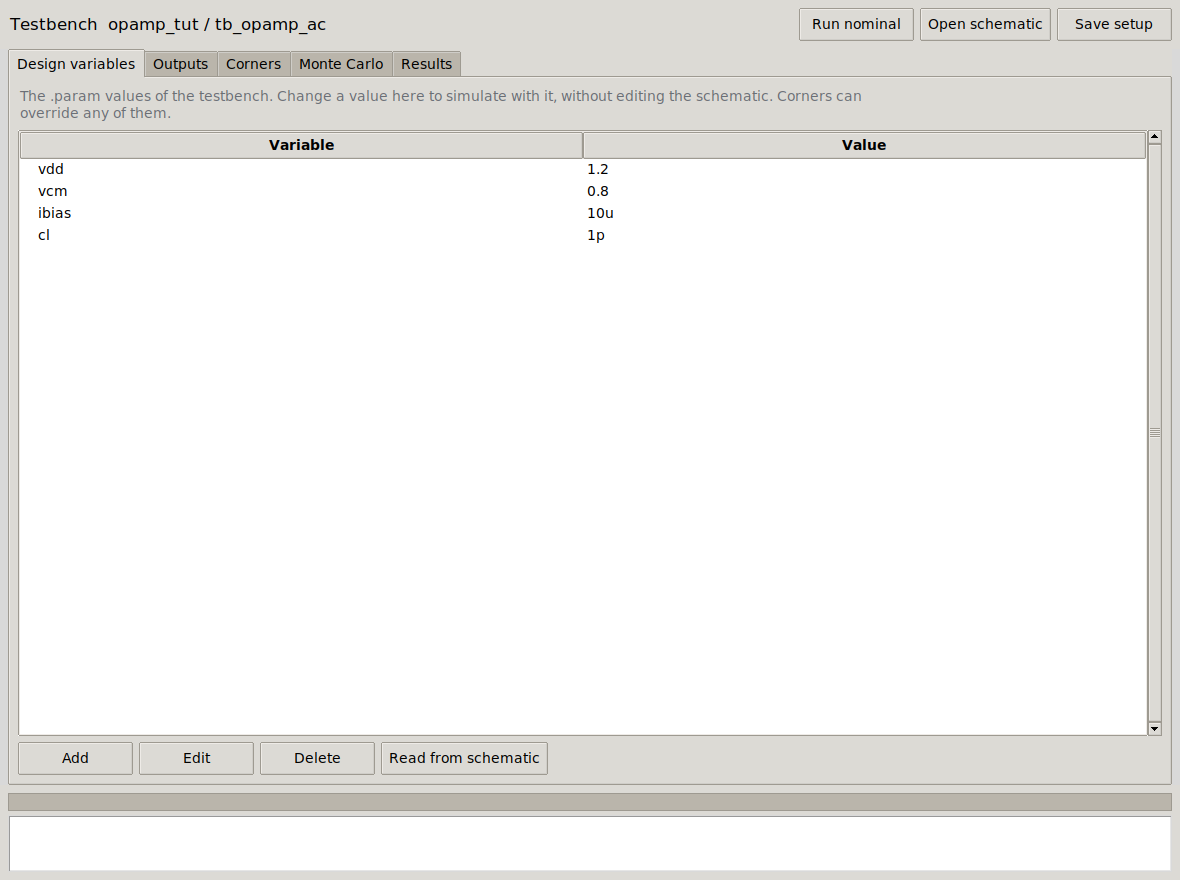
.param values of the testbench.The first time, the list is read from the testbench’s .param lines (Read from schematic does it again after you add one). Change a value here (Edit or double-click) to simulate with it without touching the schematic, e.g. cl = 2p to see what a heavier load does. Add creates a new variable: it is added as a .param line, so the schematic can use it as {name}.
3. Outputs: the performance measurements
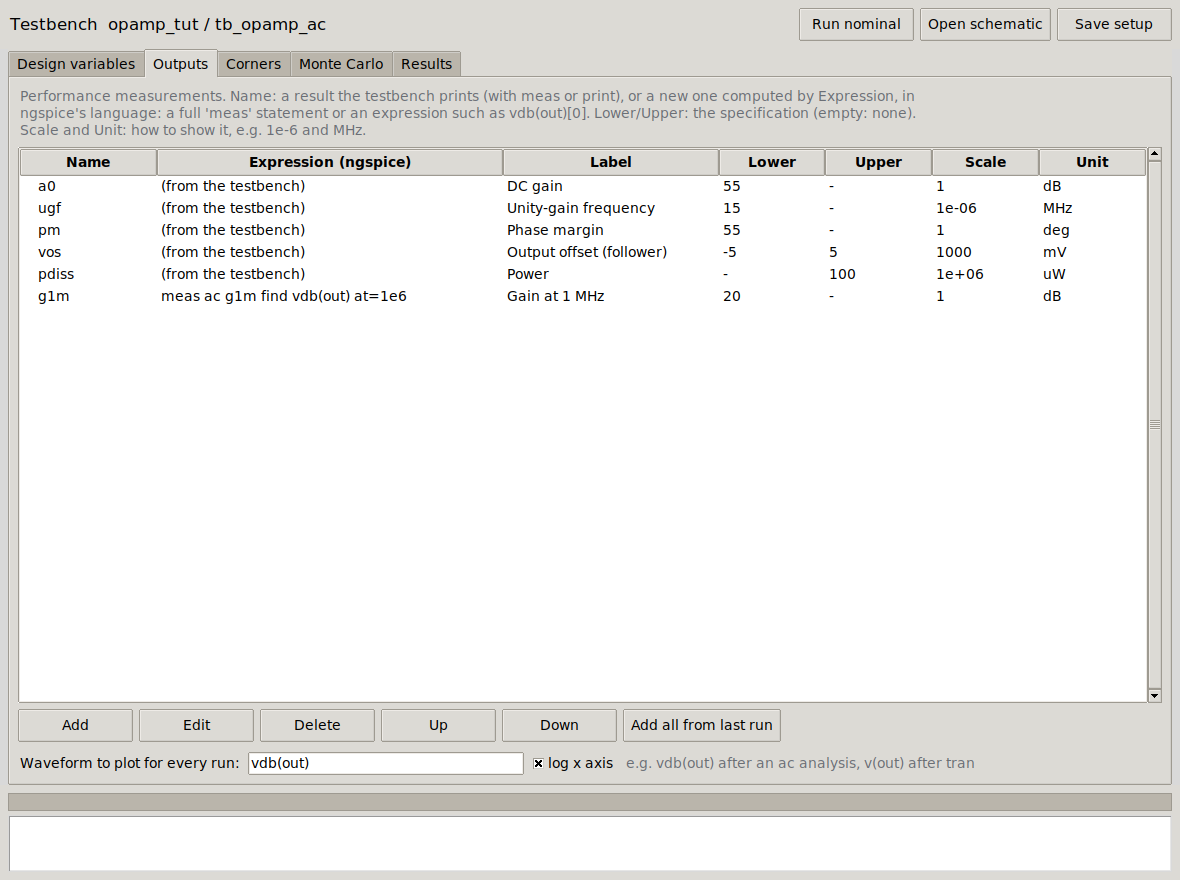
| Column | Meaning |
|---|---|
| Name | The name ngspice prints the value with. For a0, ugf, pm, vos, pdiss the testbench itself prints them (its meas and print lines). |
| Expression | For a measurement the testbench does not make: how to compute it, in ngspice’s language. Either a whole meas statement, e.g. meas ac g1m find vdb(out) at=1e6 (gain at 1 MHz), or an expression, e.g. vdb(out)[0], which FOSSLab stores with let and prints. It is added at the end of the control block, so it works on the last analysis. |
| Lower, Upper | The specification. Empty: no limit. A result outside is shown in red with ✘. |
| Scale, Unit | How to show it: the value is multiplied by Scale (1e-6 to see Hz as MHz, 1e3 for V as mV). |
Under the table, Waveform to plot for every run: an ngspice vector, e.g. vdb(out) with log x axis, drawn for all corners on top of each other.
Try it: Add an output named g1m, Expression meas ac g1m find vdb(out) at=1e6, Label Gain at 1 MHz, Lower 20, Unit dB. Nothing changes in the schematic.
4. Corners
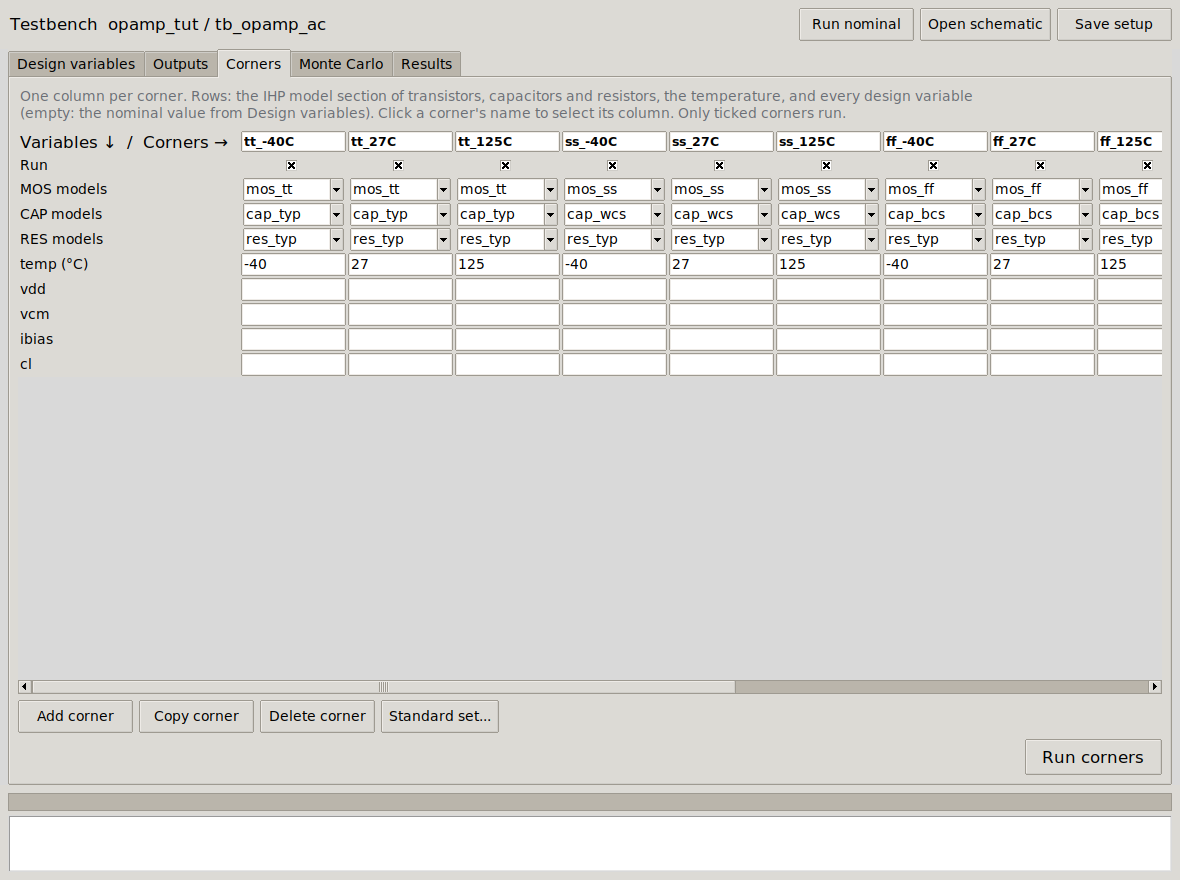
Each column is a corner; each row, what defines it:
- Run: untick to keep a corner but not run it.
- MOS / CAP / RES models: the section of IHP’s model libraries. MOS:
mos_tt(typical),mos_ss(slow NMOS, slow PMOS),mos_ff,mos_sf(slow NMOS, fast PMOS),mos_fs. Capacitors:cap_typ,cap_bcs/cap_wcs(best/worst case). FOSSLab replaces the section in the testbench’s.liblines. - temp: the temperature in °C.
- One row per design variable: empty uses the value of the Design variables tab; a value overrides it for this corner only (e.g.
vdd= 1.08 for a low-supply corner).
To change the table: click in any cell and type, or pick from the list. Add corner adds a column; click a corner’s name, then Copy corner (a copy next to it, to modify) or Delete corner. Standard set… builds the classic table: the five MOS sections × the temperatures you give (−40, 27, 125) × the supply values you give for a variable (leave it empty for none). The reference setup has the 15 corners of five sections × three temperatures.
Press Run corners. The corners run in parallel (ngspice in batch, one per CPU core); the progress bar and the log show them finish.
5. Results
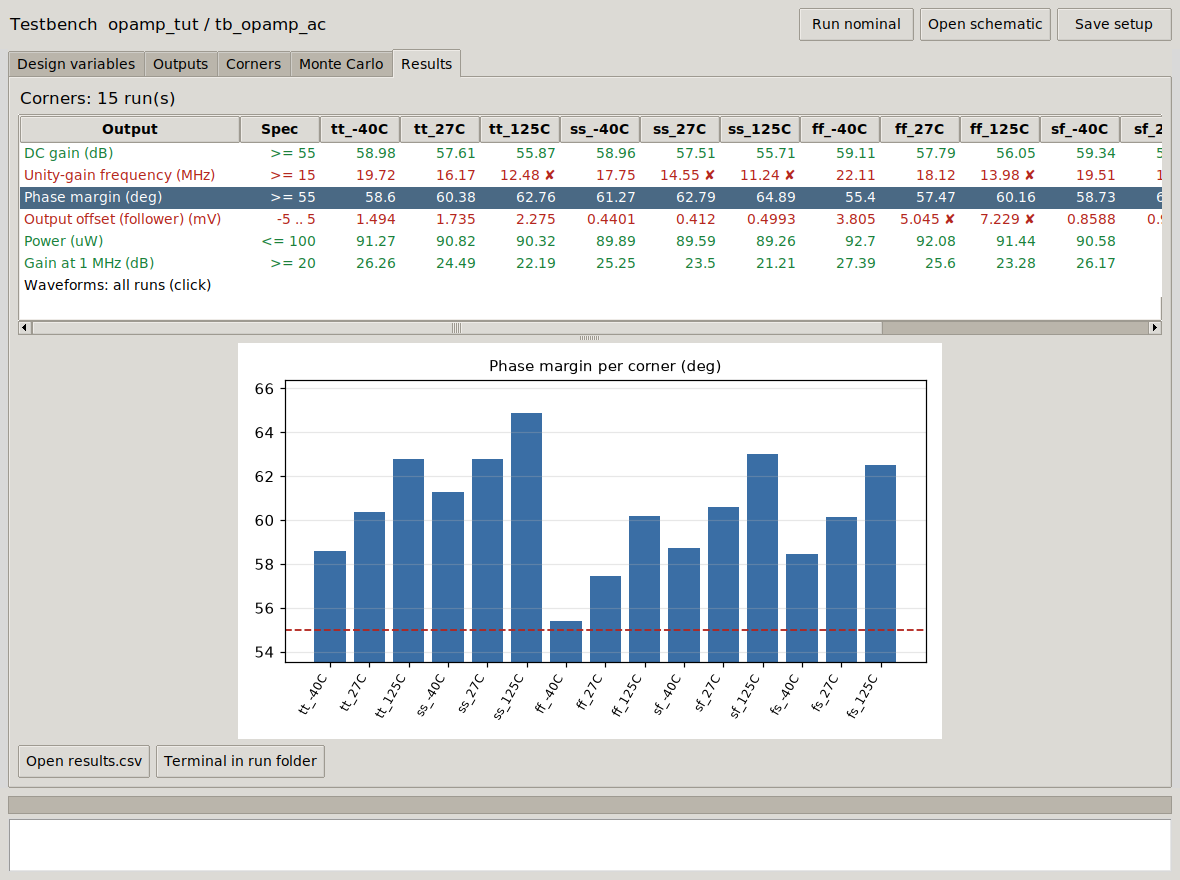
Click Waveforms: all runs for the overlay of the waveform of every corner:
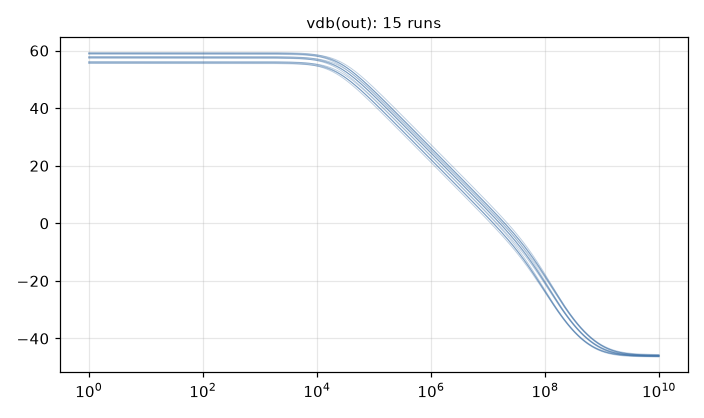
| Corner | A0 (dB) | UGF (MHz) | PM (°) | Offset (mV) |
|---|---|---|---|---|
| tt, −40 / 27 / 125 °C | 58.98 / 57.61 / 55.87 | 19.72 / 16.17 / 12.48 | 58.6 / 60.4 / 62.8 | 1.49 / 1.73 / 2.28 |
| ss | 58.96 / 57.51 / 55.71 | 17.75 / 14.55 / 11.24 | 61.3 / 62.8 / 64.9 | 0.44 / 0.41 / 0.50 |
| ff | 59.11 / 57.79 / 56.05 | 22.11 / 18.12 / 13.98 | 55.4 / 57.5 / 60.2 | 3.81 / 5.05 / 7.23 |
| sf | 59.34 / 57.94 / 56.18 | 19.51 / 15.99 / 12.35 | 58.7 / 60.6 / 63.0 | 0.86 / 0.92 / 1.15 |
| fs | 58.71 / 57.35 / 55.52 | 19.98 / 16.38 / 12.62 | 58.4 / 60.2 / 62.5 | 2.52 / 3.13 / 4.30 |
What the corners tell: hot silicon is slow (mobility falls), so the bandwidth spec fails at 125 °C in every corner, and also in the slow corner at room temperature. The phase margin is lowest where the op-amp is fastest (ff, −40 °C: 55.4°, just at the limit). The systematic offset grows when the NMOS are fast (ff, fs): the balance between M6 and M4 that cancels it only holds for matched NMOS and PMOS. These are the specifications to improve: a bigger bias current, or longer devices in the critical places.
Open results.csv gives every number in a spreadsheet file; Terminal in run folder opens the folder with each corner’s netlist and log (~/fosslab/sim/opamp_tut/tb_opamp_ac/corners/).
From the command line
The same setup runs without the window (handy for long runs or scripts): fosslab corners opamp_tut tb_opamp_ac prints the table and writes the same files.