
Chapter 10 of 14 · about 30 min
Monte Carlo analysis
Two transistors drawn identically are never identical: random variations of doping, oxide and edges make each device slightly different. This mismatch gives the op-amp an input offset that changes from chip to chip. Monte Carlo simulation draws hundreds of random circuits from IHP’s statistical models to estimate the distribution.
1. Set it up
In the Simulation Environment of tb_opamp_ac, tab Monte Carlo:
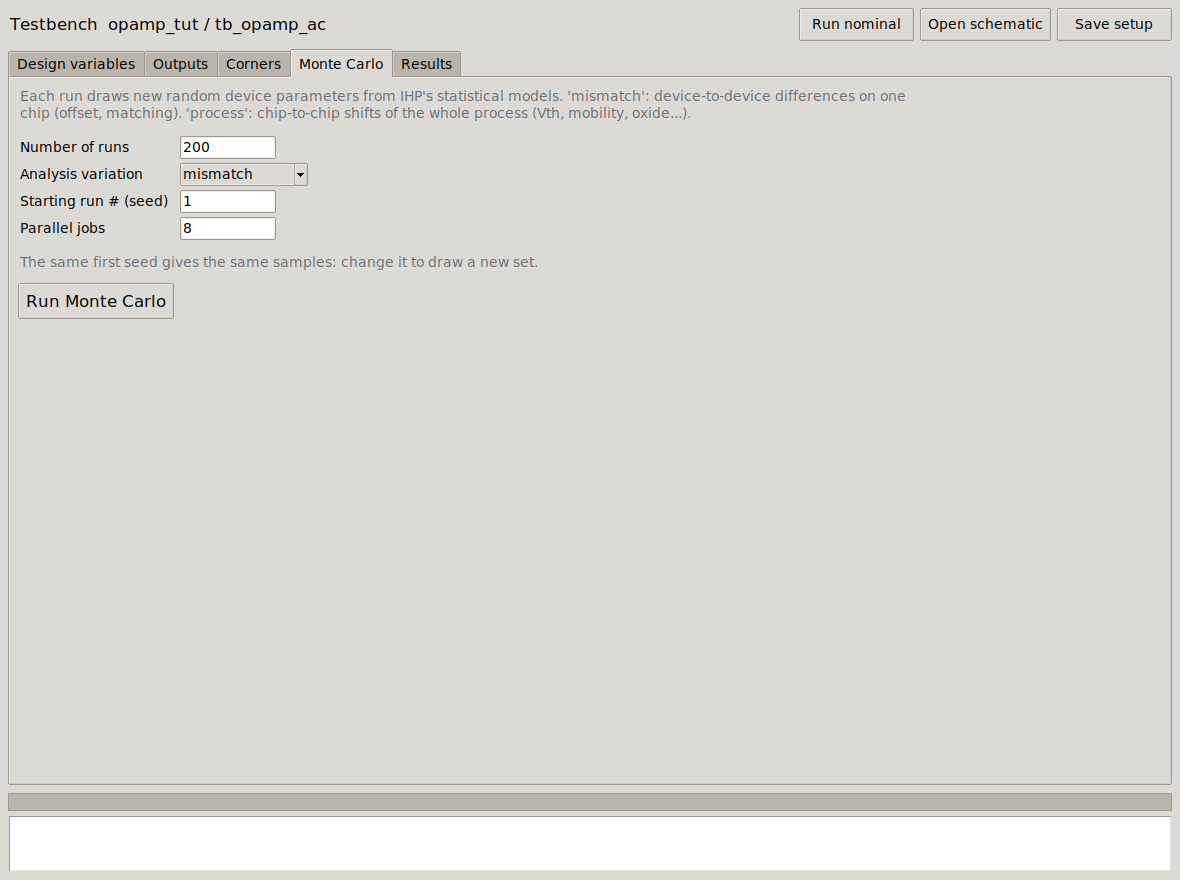
| Field | Meaning |
|---|---|
| Number of runs | How many random circuits. 200 gives a σ good to about 10 %. |
| Analysis variation | mismatch: device-to-device variation on one chip (IHP’s mos_tt_mismatch, cap_typ_mismatch sections): offset, matching. process: chip-to-chip variation of the whole process (mos_tt_stat, cap_typ_stat): every transistor’s Vth, mobility, oxide… shift together. |
| Starting run # (seed) | Run n uses the random seed start + n. The same start gives the same samples; change it for a new set. |
| Parallel jobs | How many simulations at a time. |
The outputs and their specifications are those of the Outputs tab. Press Run Monte Carlo: 200 runs take a few seconds.
agauss) that depends on its area (Pelgrom: σ ∝ 1/√(W·L)), drawn when ngspice reads the netlist. FOSSLab runs the testbench N times, each time with .option seed=n and the model section changed to …_mismatch, and collects the outputs.2. Results
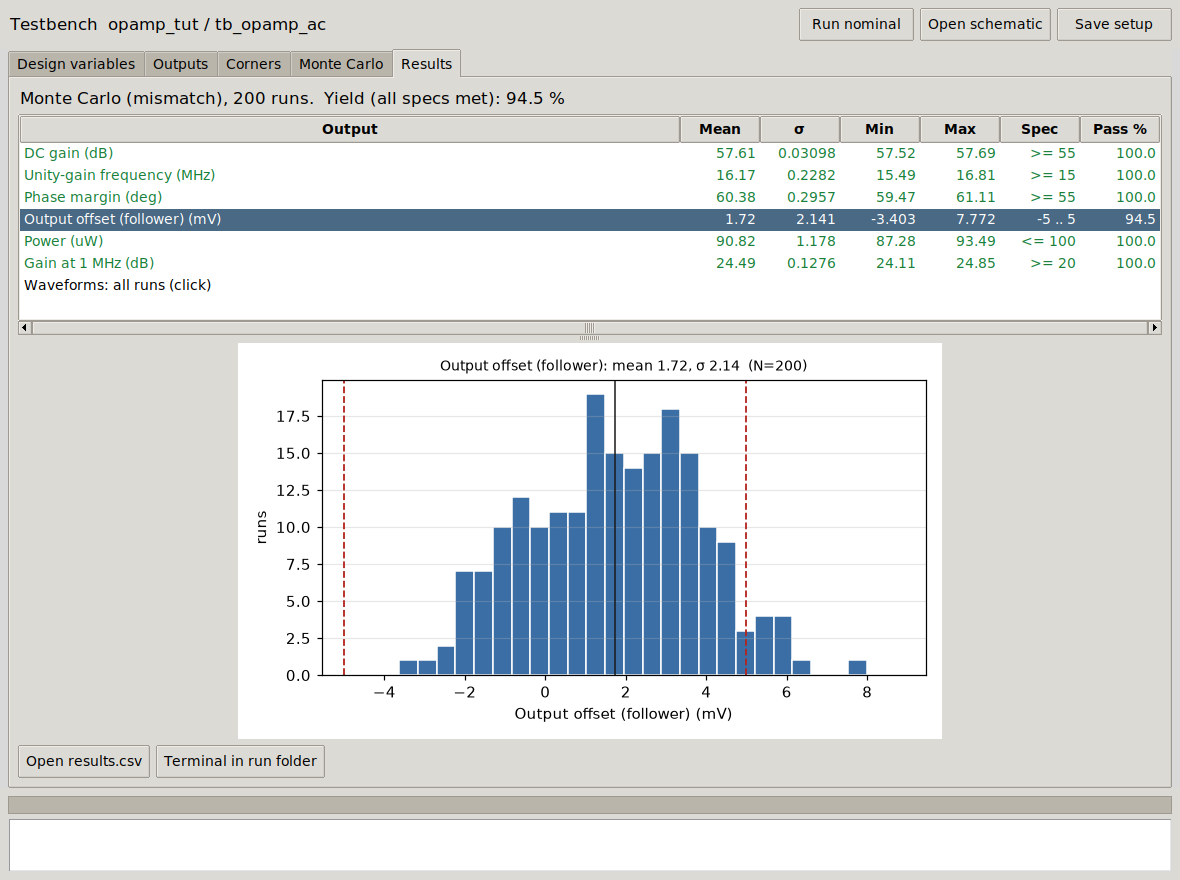
| Output (200 runs, mismatch) | Mean | σ | Min … Max |
|---|---|---|---|
| Output offset | 1.72 mV | 2.14 mV | −3.40 … 7.77 mV |
| DC gain | 57.61 dB | 0.031 dB | 57.52 … 57.69 dB |
| Unity-gain frequency | 16.17 MHz | 0.228 MHz | 15.49 … 16.81 MHz |
| Phase margin | 60.38° | 0.30° | 59.47 … 61.11° |
| Power | 90.8 µW | 1.2 µW |
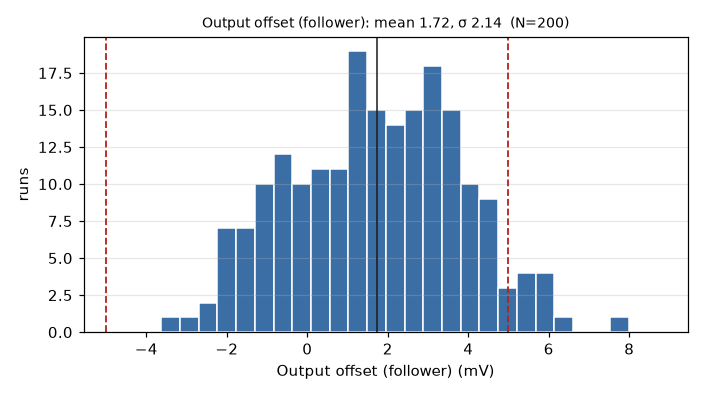
Mismatch hardly changes gain, bandwidth or phase margin: they depend on the sum of many devices, and the variations average out. It dominates the offset: σ = 2.14 mV, and 5.5 % of the circuits are outside ±5 mV: yield 94.5 %. The input pair contributes σΔVth ≈ √2 · 3.9 mV·µm / √(8 µm · 1 µm) ≈ 1.95 mV; the current mirror M3/M4 the rest. To halve the offset, make the input pair and the mirror four times bigger in area (at the cost of capacitance, hence bandwidth).
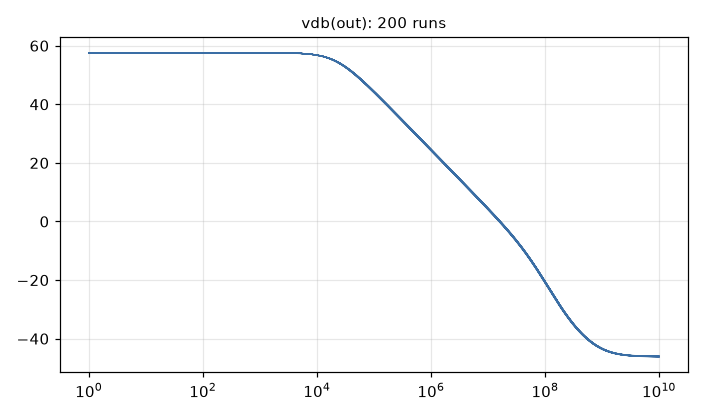
Now try Analysis variation = process (200 runs): every transistor of a chip shifts together, the way the corners assume, but drawn statistically:
| Output (200 runs) | σ, mismatch | σ, process |
|---|---|---|
| DC gain | 0.031 dB | 0.24 dB |
| Unity-gain frequency | 0.23 MHz | 0.52 MHz |
| Phase margin | 0.30° | 0.76° |
| Output offset | 2.14 mV (mean 1.72) | 1.90 mV (mean 2.26, up to 15 mV) |
Gain, bandwidth and phase margin now spread 2 to 8 times more. The offset changes as well, for another reason: not random differences between twin transistors, but the systematic offset, which depends on how fast the NMOS are compared with the PMOS (as in the ff corner). Yield: 91 %.
From the command line: fosslab mc opamp_tut tb_opamp_ac -n 200 --variation mismatch --seed 1. Every run’s netlist and log stay in ~/fosslab/sim/opamp_tut/tb_opamp_ac/montecarlo/, with results.csv (one row per run) and the histograms.