Chapter 4 of 14 · about 45 min
Testbenches and simulation
A testbench is a cell of its own that uses the op-amp’s symbol, adds supplies, sources and load, and tells ngspice what to do. Two testbenches check every specification.
1. The open-loop AC testbench
- In the Library Manager right-click
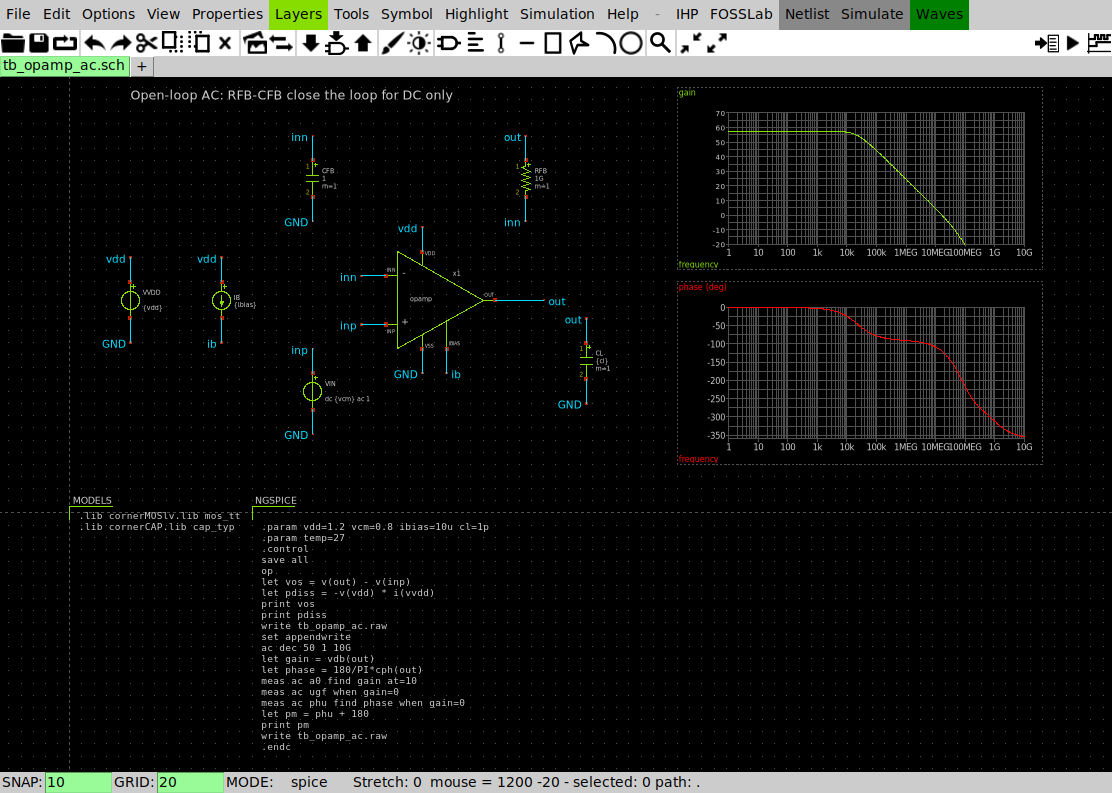
opamp> New testbench for this cell…, nametb_opamp_ac. FOSSLab creates the cell with the op-amp’s symbol placed, a label on every pin, the IHP model block and an ngspice control block. - Add (Insert, library
devices):vsourceVVDD ={vdd},isourceIB ={ibias}from vdd into IBIAS,vsourceVIN =dc {vcm} ac 1on INP,capaCL ={cl}on OUT. - Close the loop for DC only: RFB = 1 GΩ from OUT to INN and CFB = 1 F from INN to ground. At DC the op-amp is a follower, so it finds its own operating point; at any frequency above a few mHz CFB grounds INN and we see the open-loop gain.
- Edit the two code blocks (q on them):
MODELS:   .lib cornerMOSlv.lib mos_tt
          .lib cornerCAP.lib cap_typ

NGSPICE:  .param vdd=1.2 vcm=0.8 ibias=10u cl=1p
          .control
          op
          let vos = v(out) - v(inp)          * the follower's output offset
          let pdiss = -v(vdd) * i(vvdd)
          print vos
          print pdiss
          write tb_opamp_ac.raw
          set appendwrite
          ac dec 50 1 10G
          let gain = vdb(out)
          let phase = 180/PI*cph(out)
          meas ac a0 find gain at=10
          meas ac ugf when gain=0
          meas ac phu find phase when gain=0
          let pm = phu + 180
          print pm
          write tb_opamp_ac.raw
          .endc
The .param values are the testbench’s design variables: the Simulation Environment (chapter 8) can change them without editing the schematic.
Add two graphs (Simulation > Graphs > Add waveform graph, then double-click the graph to edit it): node gain for the first; for the second phase (deg);phase -1 * (xschem draws the magnitude of AC vectors, so the phase, negative here, is plotted as −|phase|: label;expression, with the expression in reverse Polish notation). x axis logarithmic, Auto load ticked, and the property rawfile=[fosslab_simdir]/tb_opamp_ac.raw, so the graphs load this testbench’s last simulation. Then Simulate (xschem’s button, or the Library Manager’s Simulate, which shows the log and the result in a window). The results go to ~/fosslab/sim/opamp_tut/tb_opamp_ac/.
2. The transient testbench
Cell tb_opamp_tran: the op-amp as a unity-gain follower (OUT wired to INN), a 0.7 → 1.0 V pulse on INP. The control block measures the slew rate between 20 % and 80 % of the step and the settling time into a ±1 mV band:
tran 1n 4u
meas tran t20r when v(out)=0.76 rise=1
meas tran t80r when v(out)=0.94 rise=1
let srp = 0.18/(t80r-t20r)
...
meas tran vfin find v(out) at=1.95u
let vband = vfin - 1m
meas tran tset_r when v(out)=$&vband cross=last from=1u to=1.95u
let tsettle = tset_r - 1u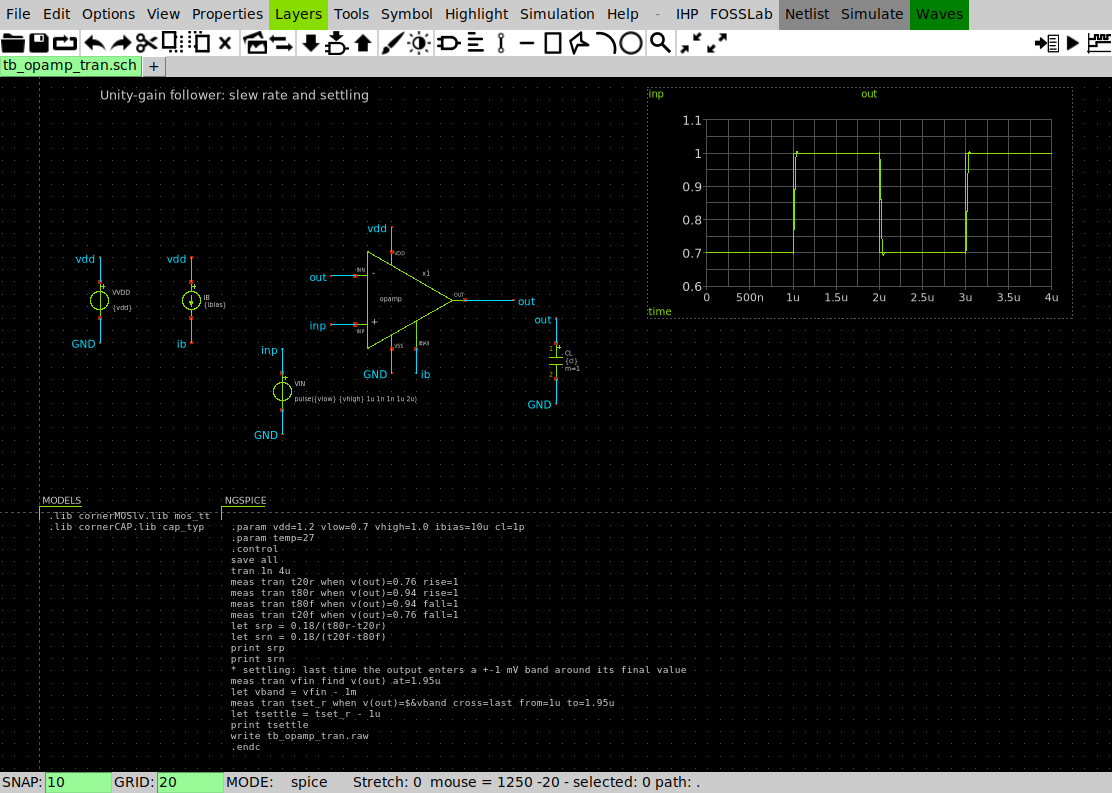
3. The results
| Specification | Target | Simulated (typical, 27 °C) |
|---|---|---|
| DC gain | ≥ 55 dB | 57.6 dB |
| Unity-gain frequency | ≥ 15 MHz | 16.17 MHz |
| Phase margin | ≥ 55° | 60.4° |
| Slew rate, rising / falling | ≥ 10 V/µs | 10.6 / 10.3 V/µs |
| Settling to 1 mV | 37 ns | |
| Output offset (follower) | ±5 mV | 1.73 mV |
| Power | ≤ 100 µW | 90.8 µW |
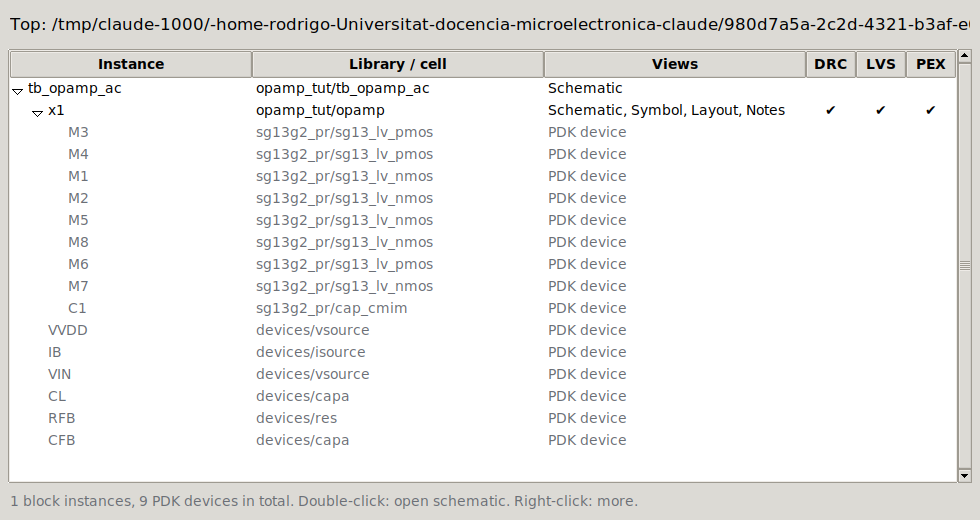
The hierarchy browser (Hierarchy button, or FOSSLab > Hierarchy browser in xschem) shows the whole design: the testbench, the op-amp inside it, and its eight transistors and capacitor.